Verification & Validation Qualification — runs entirely in your browser
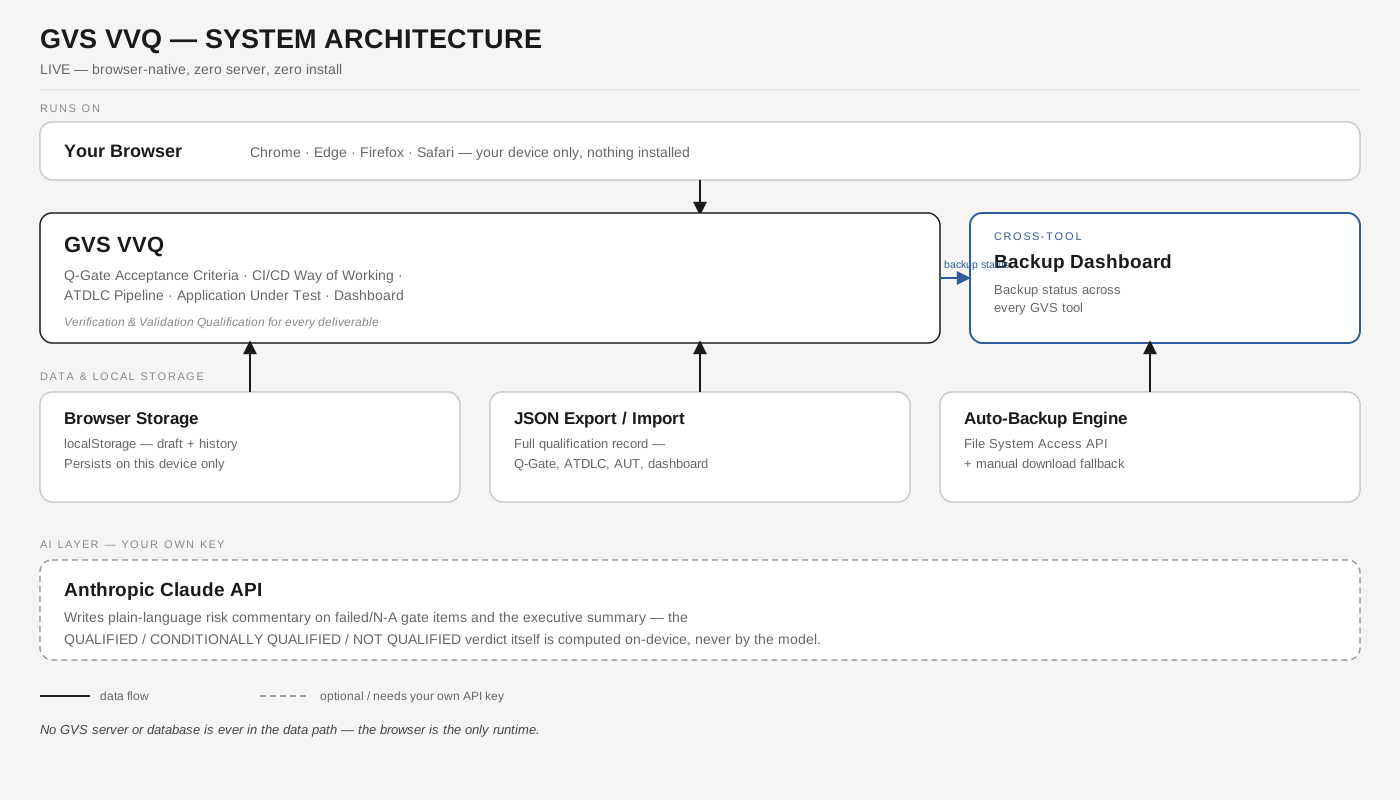
End-to-end Q-Gate acceptance criteria, CI/CD way of working, the ATDLC verification & validation pipeline, functional and non-functional Application Under Test qualification, and a multi-level dashboard for deliverables, revenue and work performance. Your data is stored only in this browser's local storage — nothing is sent to a GVS server. The only outbound call is to Anthropic's API, made directly from your browser using your own key.
// Step 1 — Deliverable
Basic context for the report header and the dashboard level this deliverable is scored against. This drives nothing in the scoring itself — the verdict always comes from the gate results in later steps.
// Step 2 — Acceptance criteria (Q-Gate)
Workflow, scheduling, and dashboard/decision-making criteria — the Q-Gate every deliverable passes through before qualification. Uncheck a category if it doesn't apply — weights automatically rebalance. Mark each item Pass, Fail, or N/A and add a short evidence note.
// Step 3 — CI/CD way of working
Containerization and the CI/CD pipeline this deliverable runs on — the DevOps model behind it.
// Step 4 — ATDLC verification & validation pipeline
Requirements → Design → Development → Testing (Functional & Non-Functional, at Component and System level) → Deployment → Delivery/Support/Operations → Customer Feedback. Mark each stage's status as the deliverable moves through it.
0 of 8 stages complete
// Step 5 — Application Under Test (functional & non-functional qualification)
Functional test coverage (system acceptance, key functionalities, entire workflow) and non-functional test coverage (load, stress, performance — burst/peak/spike/endurance conditions), the tools used, and the resulting reports.
Testing tools used
// Step 6 — Glass-box qualification assessment
The QUALIFIED / CONDITIONALLY QUALIFIED / NOT QUALIFIED verdict and every category score below are computed deterministically from your gate results — Claude only writes the plain-language risk commentary for gates that failed or were marked N/A, and the executive summary.
// Step 7 — Dashboard & report
KPI metrics across product, project, service, program, quality, operational, customer, team, individual, organisational and business dimensions, plus reports and renewals — the same dashboard view every level from CXO to TAM/HR draws from, scoped by decision-making level.